Recovery from failures in running Diego processes or tasks involves a combination of the following steps
- Look at the current state of the Diego by running the veritas tool on the OpsManager or the Diego Cell VM (bosh ssh diego_cell/0). Run ./veritas autodetect, ./veritas dump-store, ./veritas garden-containers and ./veritas distribution to understand the current state of Diego Deployment.
- Look at the failing processes using BOSH with bosh instances --ps What process is failing ?. Attempt to fix the failing processes with bosh cck or bosh restart Ensure that all the Diego processes like the BBS and BBS Brain and the Cells are running. Ensure that quorum is maintained between the Diego datastores - Etcd, Consul and BBS.
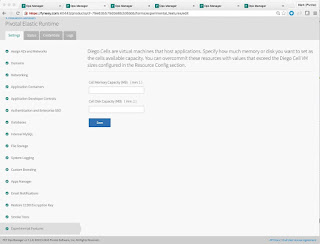
- Pay close attention to the memory and disk quotas necessary for cf app pushes to work. Diego is very conservative in its calculations for the remaining memory and disk capacity for containers. Diego never overcommits if it cannot fit the app under existing quota constraints. For the task to be run by diego the min disk per Cell >= 6GB and min. memory per Cell >= 7GB. In PCF 1.7 we’ve introduced as an experimental feature in 1.7, the ability for you to over-provision / relax the diego insistence on hard commits of memory/disk from the underlying cells.
- Look at the PCF Accounting Report. The accounting report let’s you monitor instance usage. This is kind of handy just to see what’s been running, what’s been scaling, how much you’ve used, etc. gain, this is useful to see am I hitting the limits all the time, or am I traveling well under.
- Identify repeating errors in the log from LogInsight and Splunk. This will give insight into flapping apps and other zombie instances that could be chewing up the containers.
- The rep.CapacityRemainingMemory metric shows the cell server with the least free memory. If this metric reaches or approaches 0, its a key indicator that your foundation may need more cell servers.bbs.LRPsRunning shows the total running Application Instances in your foundation. If this is a capacity issue, adding Cells via OpsManager and redeploying may fix the problem with the increased resources for staging and running apps.
- For classes of failures where Routes to apps cannot be found go ahead and bounce the bounce the diego brain VMs followed by the BBS VMs.
- For Quorum issues between etcd and consul internal stores follow advice given bbs-etcd-consul-2-is-a-cloud. Note these quorom issues have been patched in the later service releases of PCF 1.6
- Remember before opening tickets for Diego auction and runtime failures - collect metrics and logs from the Diego Brain, BBS and Cell VMs. Log collection can occur in two ways. 1. For small 2-cell deployments the Logs/Status tab of the OpsManager can be used to download logs; 2. however for a real deployment you will most likely pull out the logs from your syslog aggregator service like Splunk or ELK.
- Debug Cloud Controller Performance:
- The total number of requests completed: cc.requests.completed. This is a counter that goes up from zero. The actual number isn't so important, but you might want to look at the rate at which it grows (per min / hour) as that could give you some idea of what a "normal" load is for your CCs.
- You can look at the cc.http_status.5XX metric which tells you how many responses were returned in error. This metric is a counter that starts at zero and climbs up with each 5xx response that is returned. Seeing some 5xx requests isn't always a problem indicator, but if the number is climbing rapidly then that would be bad. Sometimes you will see a high number of 503 requests in the logs. Looking at the growth of this number (per min / hour) would be interesting. It would also be interesting to compare it to the rate of growth for the total number of completed requests. I would expect that normally this should grow very slowly compared to the total number of requests.
- There are a couple interesting metrics under the cc.thread_info.event_machine group. I believe that these report about the thread pool used by the ruby process to handle requests. In a small lab test, these three seemed interesting cc.thread_info.event_machine.connection_count, cc.thread_info.event_machine.threadqueue.num_waiting and cc.thread_info.count. The first seems to be similar to cc.requests.outstanding, an indication of how many requests are hitting the server at any given moment.The second looks like an indication of how many free threads are in the thread pool used to process requests. It works in inverse, with positive numbers indicating remaining capacity. The last is the thread count for the app. In a lab environment, this seems to hover around 21. It would grow as more threads are added.
Screenshot credit goes to the very excellent Mark Fynes. Thanks to Daniel Mikusa and Luan Santos for insight into logging and remediation actions.